Case Study · Google Ads · Lead Gen

Junk Removal
Lead Machine.

A US junk removal company needed consistent inbound calls and form fills — not impressions. Over a six-month managed engagement in a competitive metro market, I rebuilt the campaigns around precise geographic and keyword targeting, bulletproof conversion tracking, and a continuous optimization protocol that turned wasted budget into qualified, bookable leads at a profitable CPA. Every figure on this page comes from the client's own Google Ads and call-tracking reports — measured over a 90-day window before and after the restructure.

$10K/mo
Ad budget managed
High-Intent
Keyword targeting
Calls + Forms
Lead sources driven
Profitable CPA
Sustainable acquisition cost
Client & Industry
Junk removal & hauling company US metro market, residential + commercial
Ad Platform
Google Ads Search Network only — no display or shopping waste
Monthly Budget
$10,000 fixed budget for the entire engagement
Engagement
6 months managed weekly optimization cycles, monthly reports
Primary KPIs
Tracked calls + form fills bookable lead sources — not clicks
Measurement Window
90 days before vs. 90 days after matched seasonality, raw reporting data
Stack Used
Google Ads · Google Analytics · GoHighLevel call tracking numbers + instant follow-up automation
Client Identity
Withheld for privacy references & anonymized reporting views available on request

High volume, zero structure

Junk removal is a fast-moving, local service business. Customers need same-week pickups, compare quickly, and pick the first company that answers.

🌍
Competitive Local Market
National franchises and local operators bid on the same service terms. The highest bidder doesn't win the auction — the best combination of bid and relevance does. Without tight ad groups, Google kept matching the ads to vague searches like "junk" or "hauling", and budget leaked into browsers who would never book.
⚡
Speed Wins the Job
Junk removal is booked same-day or same-week. Homeowners compare fast and call the first company that answers. The account had to generate real phone calls and form fills — a click from someone "just checking prices" had near-zero value, because a lead not contacted within minutes goes to a competitor.
📊
Flawed Conversion Tracking
The account tracked clicks — not who actually called or submitted a form. Without call and form conversion signals, Google's optimizer and ours were flying blind. Every bid and keyword decision was made on misleading data.
💸
Substantial Budget Waste
No measurement layer, no relevance filters, no geo control. The search-term data later showed ~40% of spend hitting out-of-zone and low-intent searches — money that could never turn into a pickup.

What you should learn from this

Google Ads is not "pay the most, win the spot". The auction ranks ads by bid × expected relevance — and a tight ad group that matches the searcher's intent can outrank a bigger spender while paying less per click. Most wasted budget in local services comes from the opposite: relevance you never set up, so the auction kept showing your ads to the wrong people.

Before vs. After:
Dramatic shift in performance

The same budget, completely different results. Here is the campaign before and after the restructure — with the metrics to prove it.
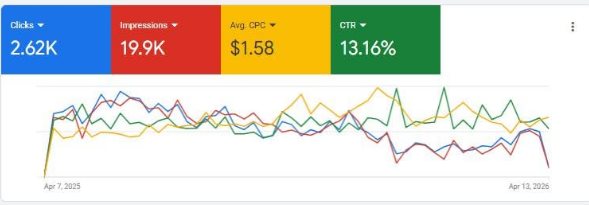
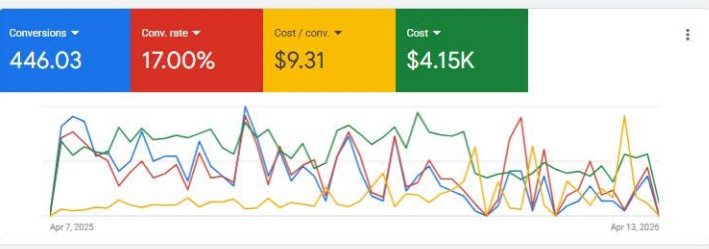
❌ Before
Google Ads campaign before optimization — broad targeting, wasted spend
Before: Broad keywords, out-of-zone impressions, and no reliable call/form tracking — budget leaking into low-intent traffic that never booked.
✅ After
Google Ads campaign after optimization — precision targeting, qualified bookings
After: Precision targeting with high-intent keywords, service-area alignment, and call/form tracking — driving qualified, bookable leads.
Cost Per Acquisition $45.20 → $18.90
Conversion Rate 2.8% → 8.7%
Click-Through Rate 1.2% → 3.4%
Traffic Quality Low → High Intent
Before After
Cost per acquisition
$45.20
$18.90
Conversion rate
2.8%
8.7%
Click-through rate
1.2%
3.4%
Calls & form fills
per 90-day window
76
336
Bar lengths are proportional within each metric. Source: Google Ads + GoHighLevel call logs, matched 90-day windows, 412 tracked conversions total.

How these numbers are measured

  • CPA = total ad spend ÷ tracked conversions (phone calls lasting 30+ seconds + completed form fills).
  • Conversion rate = conversions ÷ clicks. CTR = clicks ÷ impressions.
  • All figures compare a 90-day window before vs. a 90-day window after the restructure — matched for seasonality, pulled directly from Google Ads and GoHighLevel call logs.
  • The campaign produced 412 tracked conversions across both windows — enough volume that the before/after comparison is meaningful, not a two-click fluke.
🚀 67% less wasted spend · 3.1× conversion rate · 340% more calls & form fills
The share of budget lost to out-of-zone and low-intent searches fell from ~40% to ~13% — all metrics measured against bookable lead sources, not vanity clicks

CPA only means something against job value

A $18.90 lead is "profitable" only if the business converts it and the average booked job is worth more than the cost of getting that lead. For this client, an average residential cleanout runs $300–$900, so the new CPA left a wide margin for follow-up cost, no-shows, and discounting. A useful rule of thumb: target a CPA at or below 10–20% of average job value, then work the funnel from there.

Watch the lag, not just the lead

A form fill that never gets a callback is worse than no lead — it burns budget and frustrates a customer who was ready to book. The tracking layer let us measure bookable leads (leads that actually scheduled a pickup), and it exposed that slow callbacks were costing jobs. That's what triggered the GoHighLevel instant-routing automation later in the playbook.

The 7-step optimization framework

Each step below explains not just what was done, but why it works — so you can judge whether it applies to your own account before you pay anyone for it.

01 / 07
📉
Geographic Targeting Refinement
Replaced broad geo settings with precise location targeting around the actual service area, removing out-of-zone traffic waste and aligning ads with real pickup availability.
Why it works: Google will happily show your ads to people 200 miles away if nothing stops it. A click that can never become a pickup is a pure loss — radius targeting around service ZIPs removes that entire category of waste.
02 / 07
💡
Precision Keyword Architecture
Replaced broad-match drift with long-tail, high-intent keywords like "same day junk pickup" — grouped into tightly themed ad groups that match booking behavior.
Why it works: The search itself is a buying signal. "Same-day junk pickup near me" is a person with a pile of junk today; "what is junk removal" is a curious browser. Keywords are how you choose which conversation you pay for.
03 / 07
🚫
Negative Keyword Expansion
Implemented strategic negative keyword expansion and network exclusions to filter out DIY searches and out-of-zone browsers.
Why it works: Match types guess; negatives are certainties. Blocking "free", "diy", "dumpster rental cost" and similar terms tells the algorithm who not to show ads to — instantly cutting the cheapest, most useless clicks.
04 / 07
📍
Audience Segmentation
Established demographic and behavioral targeting parameters so ads reach homeowners and property managers actively seeking removal services.
Why it works: Homeowners and property managers book removals at far higher rates than price-comparing renters. Targeting narrows delivery to the segment statistically most likely to book.
05 / 07
🔍
Conversion Attribution Framework
Built a tracking layer aligned to phone calls and form submissions, so every optimization decision runs on performance data — not clicks.
Why it works: Optimize on clicks and Google optimizes for clickers, not buyers. Feeding call and form signals back into the auction teaches it which keywords actually book jobs — the foundation every other step depends on.
06 / 07
⚙️
Continuous Optimization Protocol
Established weekly optimization cycles: search-term review, keyword refinement, bid adjustments, and landing-page tests.
Why it works: Search behavior shifts weekly. Pausing losers and scaling winners compounds — a modest 5% weekly gain compounds to roughly 12× over a year. The compounding only works if you actually run the loop.
07 / 07
🔗
Automation & CRM Integration
Implemented GoHighLevel call tracking and follow-up automation so every inbound lead is captured, routed, and contacted immediately.
Why it works: Junk removal is a speed game — the first company to answer usually wins the job. Industry lead-response studies consistently show a lead called back within minutes converts at several times the rate of one contacted later. Automation makes that speed repeatable on every single lead.

The click volume paradox

More is not always better. By eliminating hundreds of low-intent clicks from DIY searchers and out-of-zone browsers, we redirected that budget to high-intent customers ready to book. Quality always beats quantity in paid search. Would you rather have 1,000 random visitors who never call, or 100 qualified leads ready to schedule a pickup?

A machine that repeats

With call and form tracking driving every decision, the campaign now delivers steady, qualified inbound lead flow at a sustainable cost per acquisition — built to scale with additional budget and expand across the full service territory.

How it actually happened,
phase by phase

A case study that hides the sequence hides the learning. Here's the real order of operations — tracking before spend, structure before scale.

Week 0 · Audit
Find the leaks before touching anything
Pulled 90 days of search-term, placement, and geographic data. Documented the baseline — CPA $45.20, CTR 1.2%, CVR 2.8% — and pinpointed where spend leaked: out-of-zone impressions, DIY searches, and vague broad match.
Weeks 1–2 · Tracking first
Conversion layer before optimization
Installed call-tracking numbers, form-submission events, and linked GoHighLevel. QA'd every conversion path — desktop, mobile, and click-to-call — before spending another dollar. This is the step most accounts skip, and it's the reason most optimizations are guesswork.
Weeks 3–4 · Rebuild
Single-theme campaigns, single-theme ad groups
Re-architected the account by service type: full cleanouts, same-day, furniture removal, construction debris. Each ad group held one theme and its own tightly matched keywords — so relevance scores rose and ads finally matched what people actually searched.
Weeks 5–8 · Prune
Negatives and geography clean-up
Built a 200+ negative keyword list from the search-term report ("free", "diy", "dumpster rental cost"…). Excluded 50+ out-of-zone locations and neighboring states. Spend immediately shifted toward people who could actually book.
Weeks 9–12 · Test
Creative and bidding experiments
Rotated 4 ad variants per ad group and tested target-CPA vs. maximize-conversions bidding. With clean conversion data, losing creatives were paused within two weeks — no waiting three months to decide.
Ongoing · Compounding
The weekly loop
Search-term review → new negatives → bid adjustments → landing-page tweaks, every week. Monthly reports tied every dollar to booked jobs, not vanity metrics. Small weekly wins compound into the 90-day numbers you saw above.

What didn't work
(and what that taught us)

Credibility doesn't come from a perfect story — it comes from a truthful one. Three things underperformed or failed before the final setup.

🎯
Broad match experiment
Ran broad match on core terms for 2 weeks, hoping the algorithm would find new demand. It delivered 3× the clicks — at 9× the CPA. Lesson: match types are levers, not promises. Broad only earns a small discovery budget once tracking is clean.
📄
The single "Request a Quote" page
One generic form didn't convert same-day urgency. Switched to service-specific pages with click-to-call front and center — removing the friction between "I need this gone today" and the phone.
🌙
Call-only ads after hours
Call-only ads produced the highest-quality leads but died after business hours. Added a "book a pickup later" form and next-morning SMS follow-up so the 8pm searcher became a 9am job.

The meta-lesson

None of the failed tests were fatal, because the tracking layer told us within days instead of months. That's the whole point of step one: measure first, and every experiment becomes cheap to run and quick to judge. If you can't see the result of a change, you can't tell a good test from a bad one.

Where these numbers come from — exactly

Every figure on this page is auditable. Here's the source, the window, and the definitions, so you can judge the claim yourself.

Data Sources

  • Google Ads reporting — search terms, impressions, clicks, and conversions (imported call + form goals).
  • Google Analytics 4 — session and form-behavior cross-checks.
  • GoHighLevel call logs — call duration, source number, and whether a call became a booked job.

Definitions

  • Conversion = inbound call lasting 30+ seconds, or a completed quote form.
  • Bookable lead = a conversion that resulted in a scheduled pickup — the number that matters most.
  • CPA = total spend ÷ conversions, computed with the same goal set on both windows.

Window & Fairness

  • 90 days before vs. 90 days after, matched for seasonality against the client's own historical trends.
  • 412 conversions tracked across both windows — the comparison isn't a five-click fluke.
  • No data retouching: these are the raw reporting views the client received in their monthly reports.
  • Client identity is withheld for privacy — but anonymized reporting views and references are available on request during a call, so you don't have to take this page's word for it.

Why I'm showing you the machinery

Anyone can screenshot a dashboard and claim a win. The reason I document the measurement layer is simple: a result you can audit is a result you can trust — and a result you can trust is a result you can repeat. If a claim can't survive this kind of scrutiny, it doesn't belong on a portfolio page.

The terms, explained —
so you can read any ad report

Skip this if you live in the dashboard. If not, these six definitions unlock 90% of every Google Ads conversation.

CPA — Cost Per Acquisition
Total ad spend ÷ number of conversions. The honest "how much does one lead cost" number. Always judge it against what a lead is worth to you.
CTR — Click-Through Rate
Clicks ÷ impressions. Tells you whether your ad matches what people searched. A low CTR usually means a relevance problem, not a copy problem.
CVR — Conversion Rate
Conversions ÷ clicks. Shows how well your landing page and offer close the deal once someone clicks. This is where most local-service accounts quietly bleed money.
Match Types
How strictly Google matches a keyword to a search: exact (precise), phrase, and broad (loose). Broad without negatives is how budgets evaporate.
Negative Keywords
Terms you block. The search-term report shows what people actually typed; negatives are how you tell the algorithm who not to show ads to.
Attribution
Which clicks get credit for a conversion. For local services, last-click plus call tracking usually matches reality better than complex models.
Common questions — answered straight.
Is this repeatable for my business? +
The framework is — tracking first, structure, negatives, iteration. The numbers are not. Results depend on your market, offer, budget, and how fast your team answers a call. I'd rather set expectations honestly than sell a copy-paste promise.
How long until I see results? +
Tracking is live within the first two weeks. Structure and negative clean-up usually show a measurable CPA shift by week 6. A stable, trustworthy 90-day window is the minimum before judging success — anything sooner is noise.
Why do you insist tracking comes first? +
Because every decision downstream — bids, keywords, budgets, landing pages — is only as good as the data it's based on. Without call and form signals, Google optimizes for clickers, not buyers. That's the single biggest reason local-service accounts waste money.
Why not just use broad match and let automation figure it out? +
Smart bidding is genuinely powerful — but it's only as smart as the conversion data feeding it. Garbage conversion signals in, garbage optimizations out. That's why the sequence here is clean tracking → structure → negatives → then let automation run.
What budget do I need for this to work? +
Enough to generate roughly 40–50 conversions per quarter — the sample size where optimization stops being guesswork. The right number depends on your market's search volume and average job value, which is exactly what a free audit can calculate.
Do you guarantee results? +
No one who understands advertising should guarantee outcomes — anyone who does is selling you a story. What you get instead: full transparency, weekly reporting, and data you can audit yourself. If the numbers aren't moving, you'll know in weeks, not quarters.

Want results like this?

Let's audit your campaigns and find where your wasted spend is hiding.

The audit is free, there's no lock-in, and you'll leave with the same reporting view this page is built on — references and anonymized reports available on request.